Is Reliance Industries Ltd (RIL) Buy or Sell? What are the likely price targets in 3-6 months? If you are holding the stock, what’s a good price to take profit?
What should be your stop loss? Get these valuable answers in our stock report.
Contact us for a Sample Stock Report. Thanks.
Fee per stock report: $49 USD
Delivery time: 1 day
All posts by Alpha Stock Trading
S&P500 Technical Analysis – 25Nov2015

S&P500 Technical Analysis
Date:11/25/2015 O=2084.00 H=2092.50 L=2082.25 C=2088.00 V=743,484
RSI Indicator:
Conventional Interpretation: RSI is in neutral territory. (RSI is at 59.39). This indicator issues buy signals when the RSI line dips below the bottom line into the oversold zone; a sell signal is generated when the RSI rises above the top line into the overbought zone.
Additional Analysis: RSI is somewhat overbought (RSI is at 59.39). However, this by itself isn’t a strong enough indication to signal a trade. Look for additional evidence before getting too bearish here.
Continue reading S&P500 Technical Analysis – 25Nov2015
Indiabulls Real Estate- Stock Analysis 14Sep2015
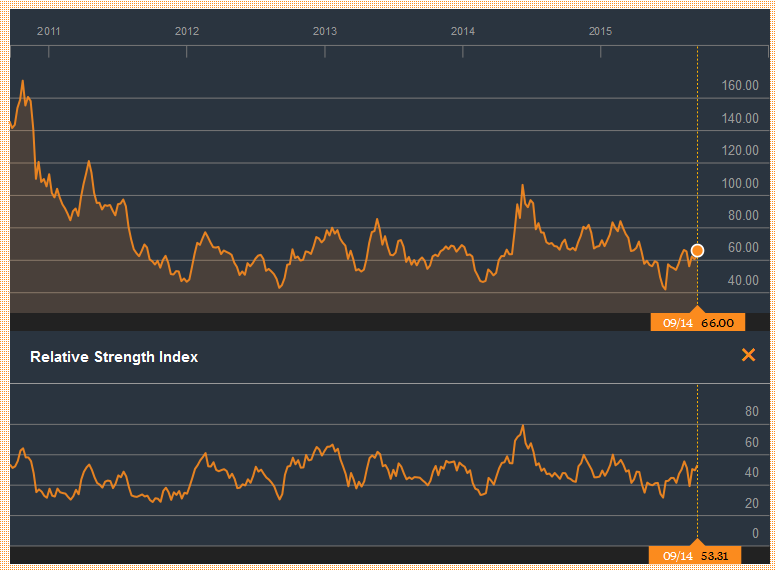
Indiabulls Real Estate is one of the most resilient stocks in the Indian stock market. It has not gone up in last 3 years due to weak economy, but the stock bounces back from lower levels, making it one of the best buys on all major corrections. Above 50, the stock can test 70 and 80, which is very good return.