Nifty closed today at 5989, and has reached significant support zone. If 5950 to 6000 holds then Nifty may be ready for big upmove of 200 points towards 6200. Downside risks are smaller than upside potential as of today after after 7 consecutive Red Days. The Nifty and Bank Nifty have held their support levels. The Nifty intra-day movements were choppy, but with all the noise, the Index maintained its support area of 5950 to 6000. The Bank Nifty also holds its minor support and closed higher. SBI and ICICI Bank closed in green showing their readiness to move up sharply at first opportunity. The risk reward scenario for new long positions in the Nifty is good for 150-200 points gain, towards 6150-6200. Choppiness continues in CNX IT and prices are trading inside a large trading range. In the CNX REALITY Index, which reflects the real estate sector, trend is down in this sector and prices are moving down.
Nifty P/E Chart – Nov2013

Nifty gets strong buying when it falls to P/E 15. A revisit to P/E 17 is possible based on the P/E chart (blue), which would correspond to about 5750 on Nifty Index price, which would also re-test the 200 DMA at 5850. Markets are moving rapidly between optimism and pessimism.
SPY Longterm Chart Analysis Oct 2013
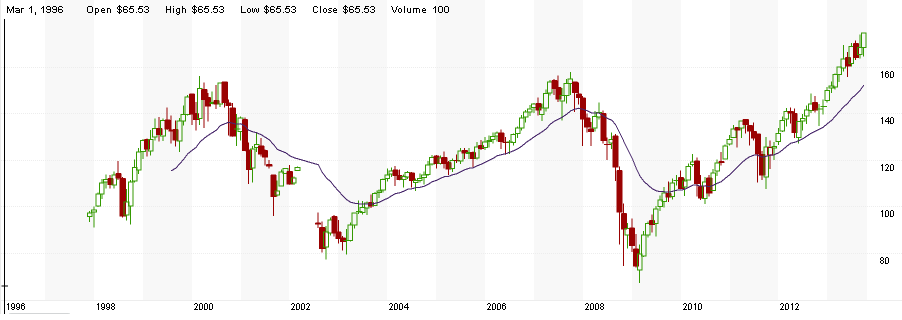
Above is the long-term monthly chart for SPY, the S&P500 ETF, as of Oct 2013. This is the world’s largest ETF tracking the S&P500 index, which closed at 1744 (on Friday Oct 18, 2013). On the chart, we have plotted a long-term mean line (call it whatever you wish – moving average, or support line, or average buying prices). This line is important because prices tend to get buying support on reaching the line, and bounce back after falling 20-30% below this line. A simple way to understand this line is that majority of SPY ETF investors are at their cost price around the line, neither in profit, nor in loss. Right now, in Oct 2013, the SPY is significantly stretched out, away from the average line, with a majority of investors in good profits, and if they decide to take their profits, the prices won’t be where they are currently because of increased stock supply. Therefore, a reversion to the mean line is just a matter of time, most probably in 2-3 months. Historically, the months of Jan-Feb tend to give large corrections, so we should not suprised if Jan-Feb 2014 unleashes 20% market-wide correction, which can take the S&P500 to 1530 level from the current 1744. What could trigger this correction? Maybe the US debt ceiling debate in Jan 2014 will result in something different next time, something which the markets are not prepared for. The current market level is ideal for booking profit and waiting for lower levels in coming months for redeploying capital.