Investors can buy #Infosys shares at 640, or $8.95 (cmp for INFY ADR) and all further corrections, for 20-25% gain in next 9-12 months. This is a good buying opportunity. #INFY is a very dependable company, with large scale global operations, and all this won’t change overnight.
Infosys stock has been hit today by whistle blower allegations of accounting malpractice related to the recognition of costs and margin reporting of its large deals pushed by its CEO. It appears that the whistle blowers are senior executives of the finance department. Obviously, this is very sensitive and damaging update, and we can expect the Infosys stock to go down with selling pressure till suitable and satisfying reply comes from Infosys Board. The SEC has also been informed about it, so this will take several days or weeks to clear out.
Infosys ADR (NYSE:INFY) is down 13% currently at $9.25 and its showing signs of recovery from oversold levels. But this is not going to be solved in one day. Infosys stock in India will be open for trading tomorrow 22 Oct 2019. It can fall till Rs 630-650 before during this correction period. Infosys stock is a good buying opportunity at Rs 650 for target Rs 900 over the next 2 years, because Infosys overall business is doing well, and it is a fundamentally strong company with diverse portfolio of IT services for large clients worldwide.
The financial impact of this episode appears less but the reputation impact is high. Investors should not rush buy the stock immediately on correction, but they should wait for good reply to come. The stock will tend to bounce back and also correct further till things stabilize. Summary: Buy Infosys (INFY) at 650 for Target 900 in 2 years.
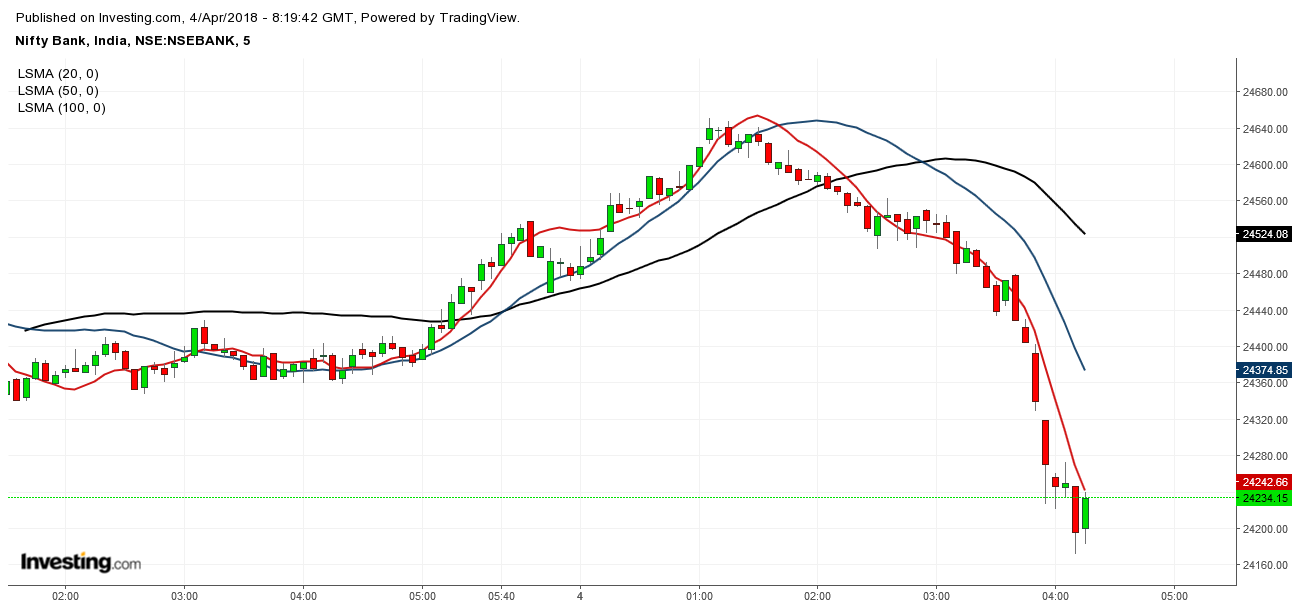
Bank Nifty is a highly sensitive index with sharp response to various domestic and international events, especially those linked to interest rates, currencies, international trade, etc. Its has nearly 2x beta compared to Nifty index. Feb2018 and Mar2018 were bad for Bank Nifty and it had sharp correction from 27,000 to 23,500 – PNB scam, and interest rate hikes in the US and ICICI Bank issue concerning MD/CEO.
Observe this intraday chart (5 min) carefully for valuable lessons. The lessons will be useful/relevant for larger timeframes of 15-30-60 min also.
Downside Risk increases below 100 LSMA
Downside Risk increases rapidly when 20 LSMA and 50 LSMA cut below 100 LSMA