Category Archives: US Stock Market

SPY Longterm Chart Analysis Oct 2013

spy-longterm-chart-oct2013

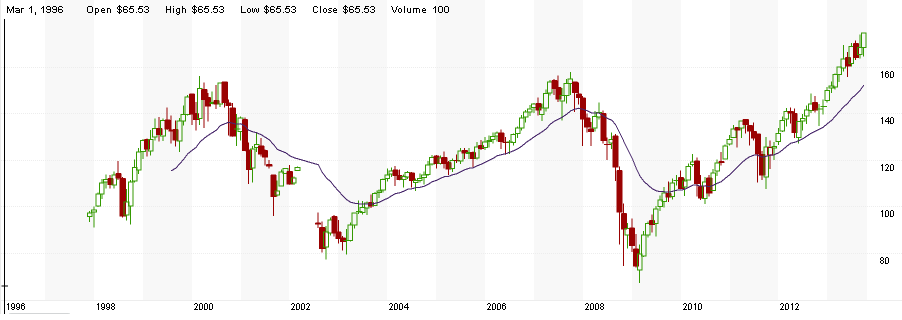
Above is the long-term monthly chart for SPY, the S&P500 ETF, as of Oct 2013.  This is the world’s largest ETF tracking the S&P500 index, which closed at 1744 (on Friday Oct 18, 2013). On the chart, we have plotted a long-term mean line (call it whatever you wish – moving average, or support line, or average buying prices). This line is important because prices tend to get buying support on reaching the line, and bounce back after falling 20-30% below this line. A simple way to understand this line is that majority of SPY ETF investors are at their cost price around the line, neither in profit, nor in loss. Right now, in Oct 2013, the SPY is significantly stretched out, away from the average line, with a majority of investors in good profits, and if they decide to take their profits, the prices won’t be where they are currently because of increased stock supply. Therefore, a reversion to the mean line is just a matter of time, most probably in 2-3 months. Historically, the months of Jan-Feb tend to give large corrections, so we should not suprised if Jan-Feb 2014  unleashes 20% market-wide correction, which can take the S&P500 to 1530 level from the current 1744. What could trigger this correction? Maybe the US debt ceiling debate in Jan 2014 will result in something different next time, something which the markets are not prepared for. The current market level is ideal for booking profit and waiting for lower levels in coming months for redeploying capital.

Global Economic Events & Triggers – Sep2012

USA:
06 Sep :Jobless claims
13 Sep : FOMC rate decision
14 Sep : Industrial production
19 Sep : Housing starts

European Union (EU):
03 Sep : Eurozone PMI Manufacturing
06 Sep : ECB Interest rate decision
12 Sep : Germany’s constitutional court rules on euro bail out fund
14 Sep : Eurozone employment data
18 Sep : Spain to sell treasury bills
Continue reading Global Economic Events & Triggers – Sep2012

Crude Oil Prices and Global Economic Recovery

https://encrypted-tbn0.google.com/images?q=tbn:ANd9GcQcF6SzmY7PCteGfkkuZHtcvaHEZ1uryeqRr7fG_UE8cfm6PJYBMonday, 02 April 2012:  China reported positive news on their industrial production over the past weekend, which should give some positive support for global markets and commodities. The current Crude oil price of $105 is about $30 more than its 5 year futures, which indicates that crude oil prices can come down if favorable political events take place to reduce middle-east geo-political tensions, but the chances of such positive events is slim, so we will have to work with constant upward movement in crude oil prices till some event creates genuine risk to crude oil prices.

As of now, a significant amount of risk capital has moved into crude oil, because global economic growth scenario looks more likely than global recession. Meanwhile, Natural Gas prices have been hitting 8 year lows, and huge price variations from $2 per mmbtu in USA to $8 per mmbtu in India/Asia because it is not mobile like crude oil. Continue reading Crude Oil Prices and Global Economic Recovery